Spectrum Slit
By Andrew Gregory. Posted
Your eyes and ears are sensitive to a tiny range of wavelengths. Other living creatures can perceive different parts of the spectrum – bees, for instance, can pick up visual information in the petals of flowers that we can’t see at all. But even though we can’t see these hidden RF signals, it doesn’t mean they’re not there. If you have a computer and a phone – each with Wi-Fi, Bluetooth, and their background electrical noise – you’re immersed in a cacophony of RF signals.
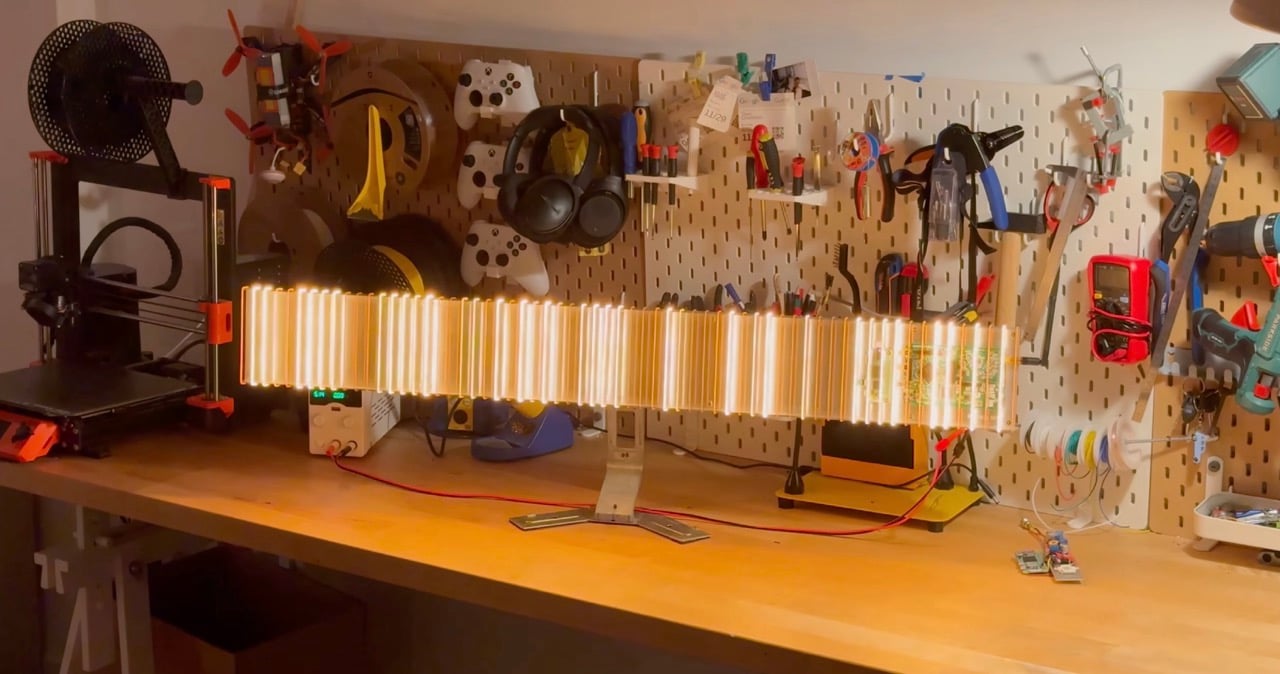
This work exposes that hidden layer of reality by translating radio wave activity into light (and sound) in real time. It measures radio signals within the 2.4GHz–5GHz bands frequencies used by Wi‑Fi, Bluetooth, and other domestic wireless devices, and visualises them with 64 glowing filaments arranged to visually echo a scientific frequency plot.
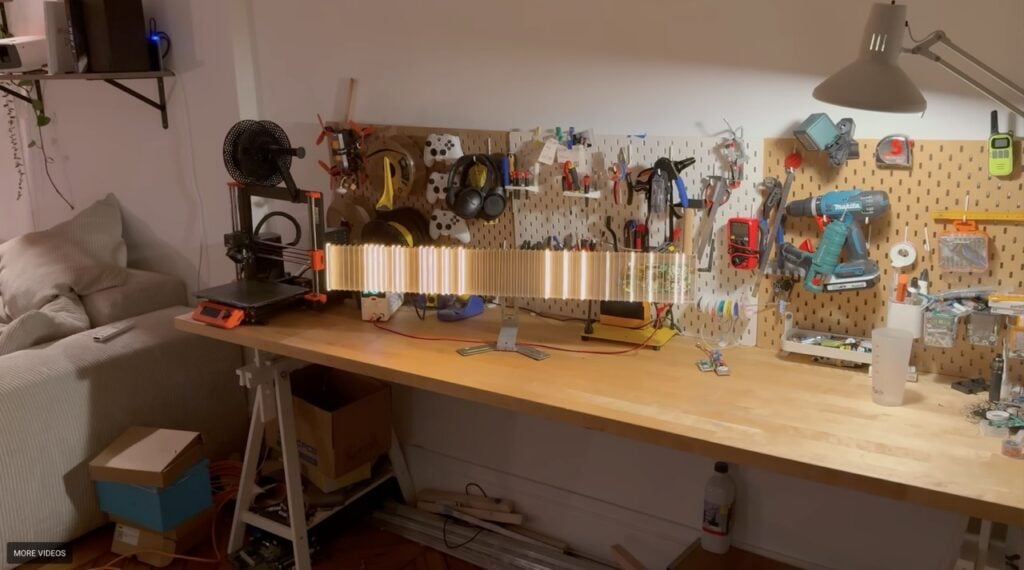
The measuring of the RF spectrum is performed by a HackRF One, which is a software-defined radio that can detect frequencies ranging from 10MHz (commonly used for calibrating electronic equipment) to 6GHz (used by high-speed Wi-Fi). The HackRF One continuously scans this frequency range, sending signals to a Raspberry Pi 5 which parses the information and drives the lights.

Features Editor Andrew trawls the internet for Cool Stuff while keeping the magazine running smoothly.
Subscribe to Raspberry Pi Official Magazine
Save up to 37% off the cover price and get a FREE Raspberry Pi Pico 2 W with a subscription to Raspberry Pi Official Magazine.
More articles
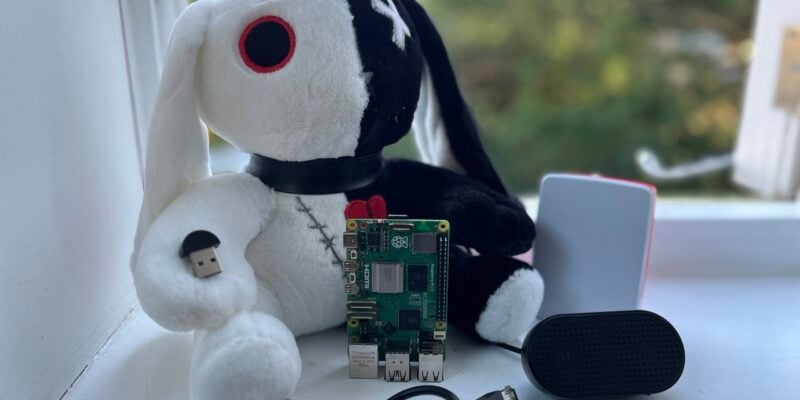
Set Marvin Free
Do you dare free a demon possessing a stuffed animal?
Read more →
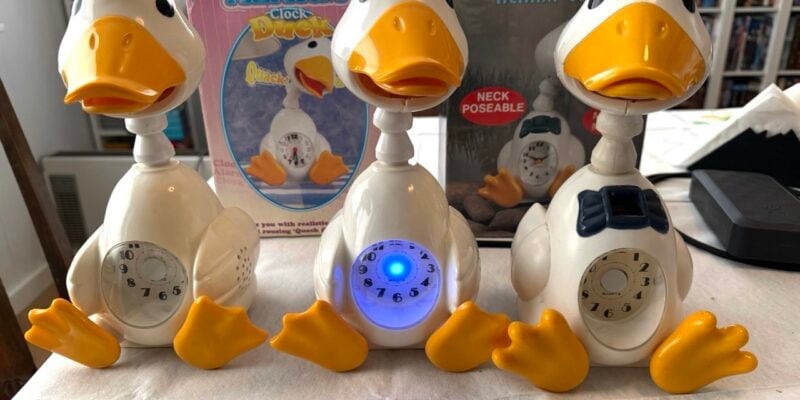
oDuckberry
A novelty alarm clock has been turned into something ‘pro-duck-tive’
Read more →

Review – Pitower Gen 1 case
It seems quite popular now for folks to make their Raspberry Pi look like a diminutive desktop PC. The Pitower Gen 1 from Elecrow manages to do that while also making sure you can still use your Raspberry Pi as, well, a Raspberry Pi. Construction is fairly simple if lengthy – it took the better […]
Read more →